What is Ultrasound Localization Microscopy (ULM)?
Microbubble-enhanced functional ultrasound imaging
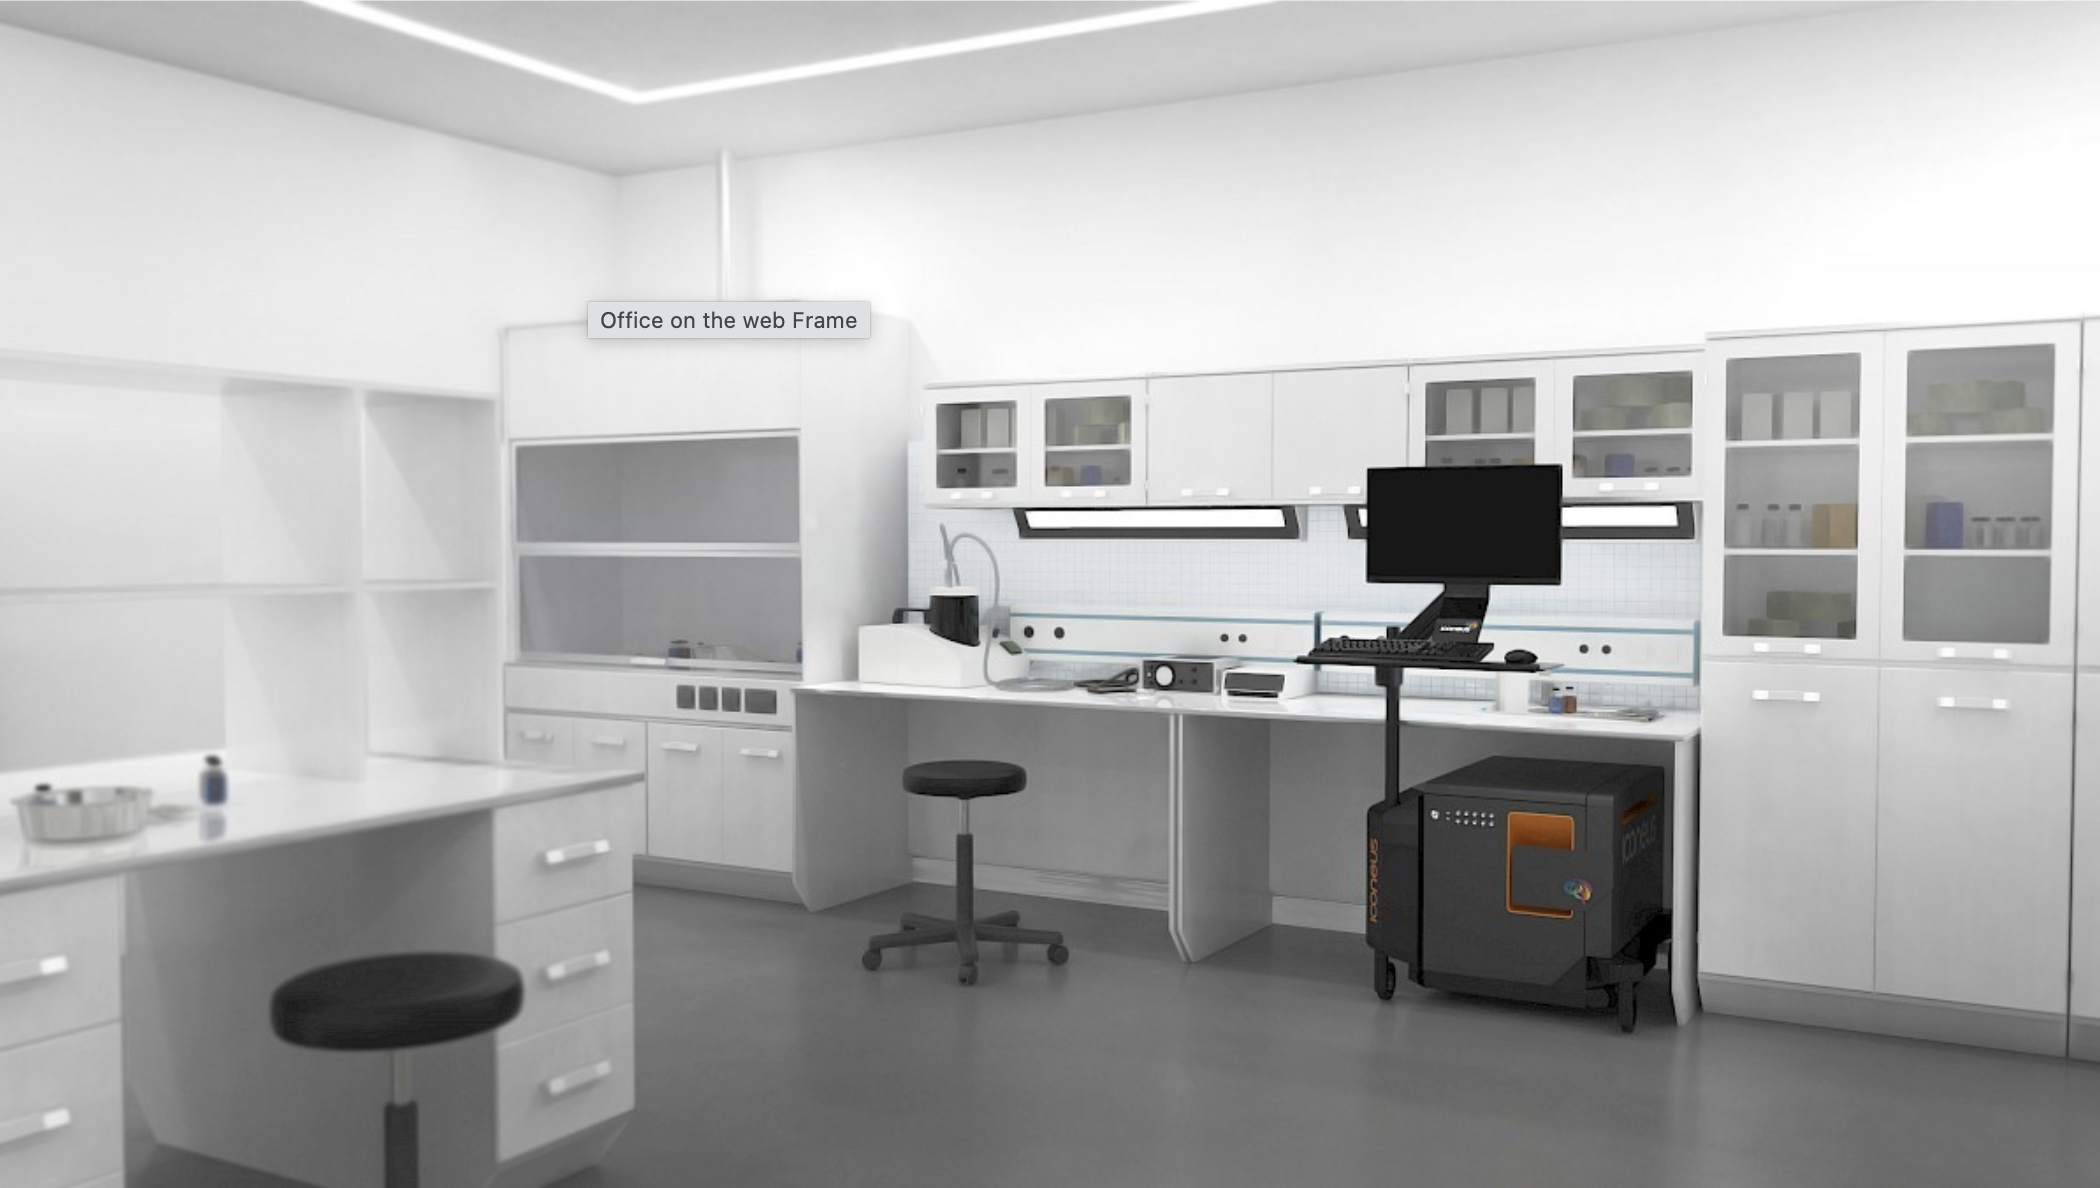
Ultrasound Localization Microscopy is a microbubble-enabled imaging technique that allows users of the Iconeus One functional ultrasound system to image blood vessels in the brain with amazing detail.

How does ULM work?
First described by the founders of Iconeus in a widely-cited 2015 article in Nature, “Ultrafast ultrasound localization microscopy for deep super-resolution vascular imaging“, ULM uses injected gas microbubbles as a contrast agent to greatly enhance the resolution of functional ultrasound for various animal models (such as mice and rats).
The process of ULM imaging involves three steps:
- Microbubbles are injected into the bloodstream and detected using fUS.
- Each frames for each time point (t, -t,) are separated and filtered to remove the slowly-changing signal from the tissue, and highlight individual microbubbles.
- The positions of the microbubbles are pinpointed, and their trajectories are superposed to create a highly resolved localization map.
Visualizing the brain with ULM
The main features of ULM include:
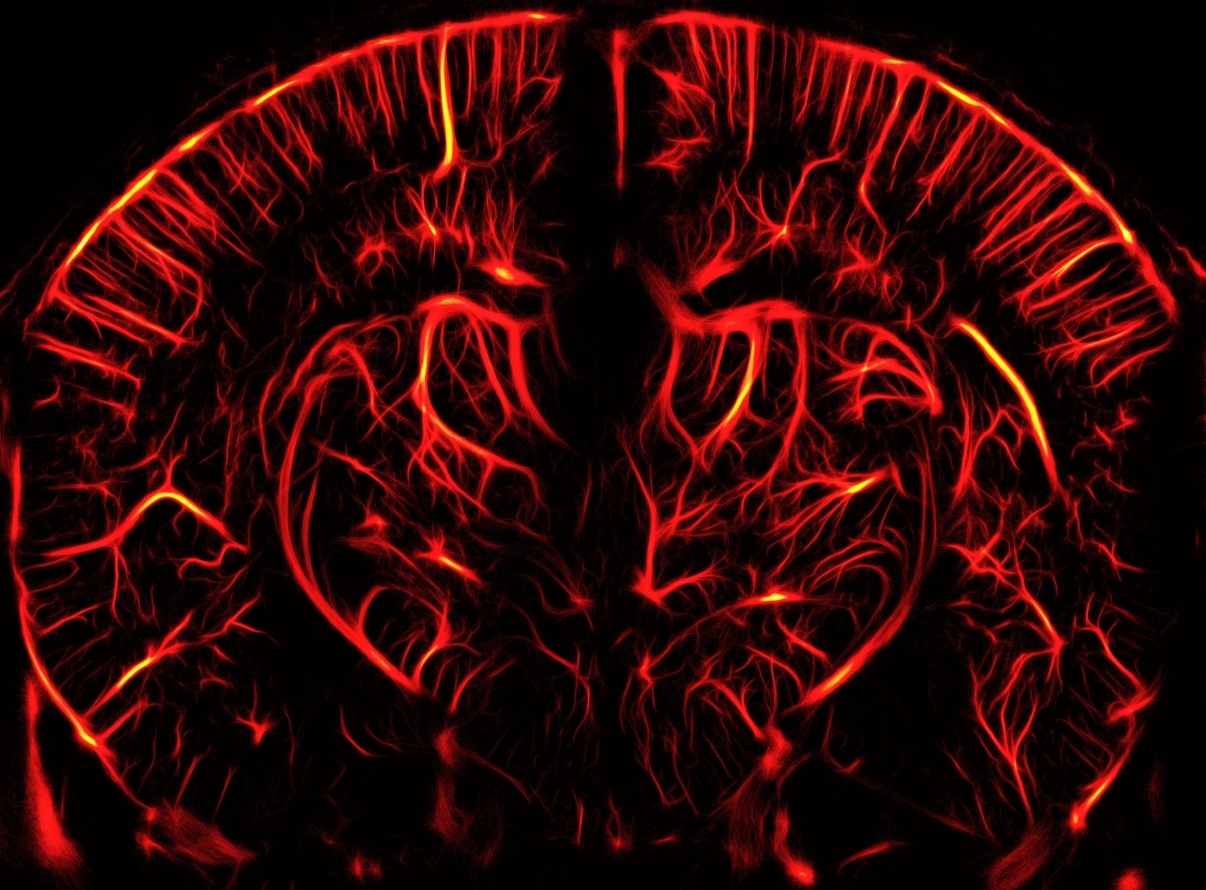
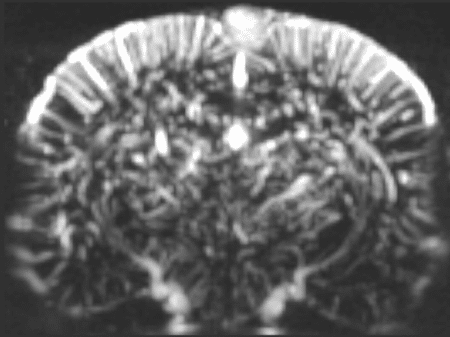
- High resolution: ULM can achieve an in-plane resolution of about 5 μm, allowing you to create high-resolution vascular maps of the brain.
- Microbubble tracking: With ULM, you can count and track individual microbubbles as they travel through the blood vessels, allowing even more detailed analysis.
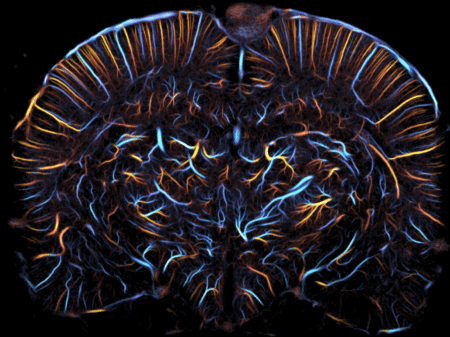
- Blood velocity quantification: ULM enables the measurement of blood velocities in the mm/s range, including the direction of flow, enabling you to distinguish between different types of blood vessels (such as arterioles and venules).

From 2D to 3D…
In 2022, we released a study showing the extension of ULM to three dimensions – an advance that promises to allow even more comprehensive analysis of brain structures and functions. Get in touch with us to discuss the latest prospects.
…and from preclinical to clinical
The temporal resolution of ULM is about 60 s, but we’re currently working to reduce this to less than 1 s as part of our ‘functional ULM’ project. This would allow us to map brain activity and connectivity in real-time, and holds promise for diagnosing and monitoring treatment in humans, too.
Learn more about ULM
Would you like to talk to us about ULM on the Iconeus One system?
Contact us to explore its potential for your research.