In an analogous fashion to fMRI, functional ultrasound can be used to map intrinsic brain connectivity (often called resting-state functional connectivity or resting-state networks), by detecting correlated fluctuations of spontaneous blood flow.
The high spatial and temporal resolution of fUS, and its much greater inherent sensitivity than BOLD-based fMRI, makes it a powerful way of studying neuropsychiatric diseases, and potentially aiding early diagnosis. Below are a few examples of fUS in action.
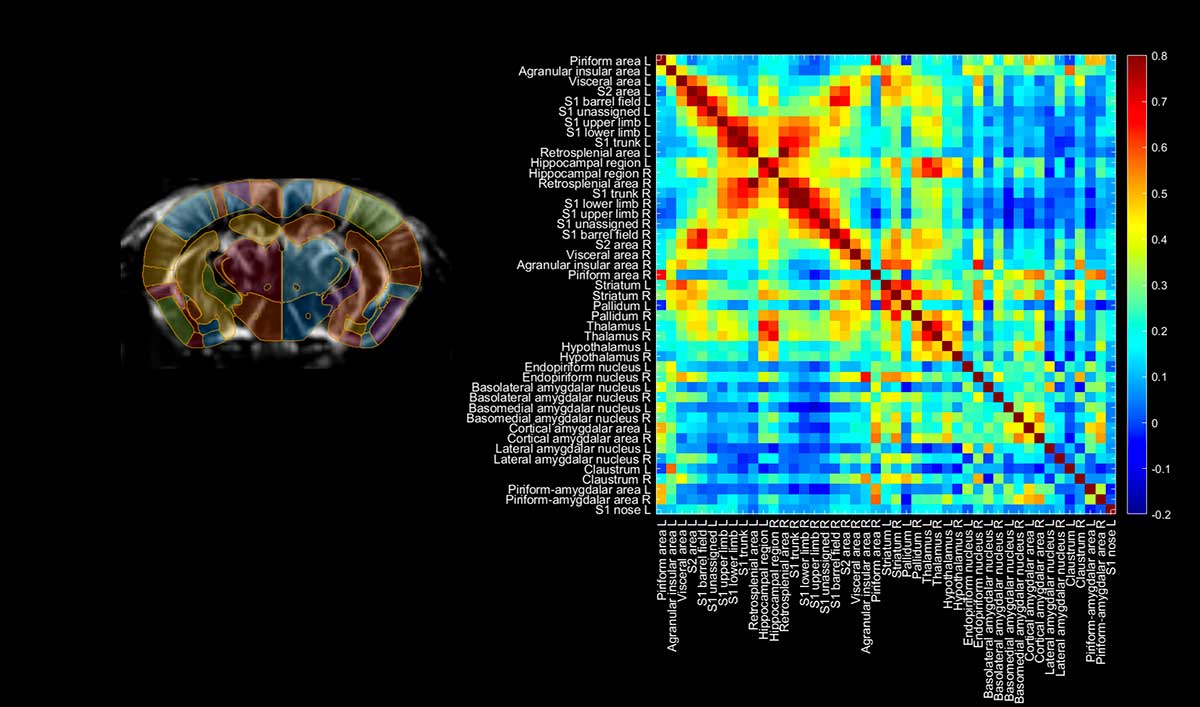
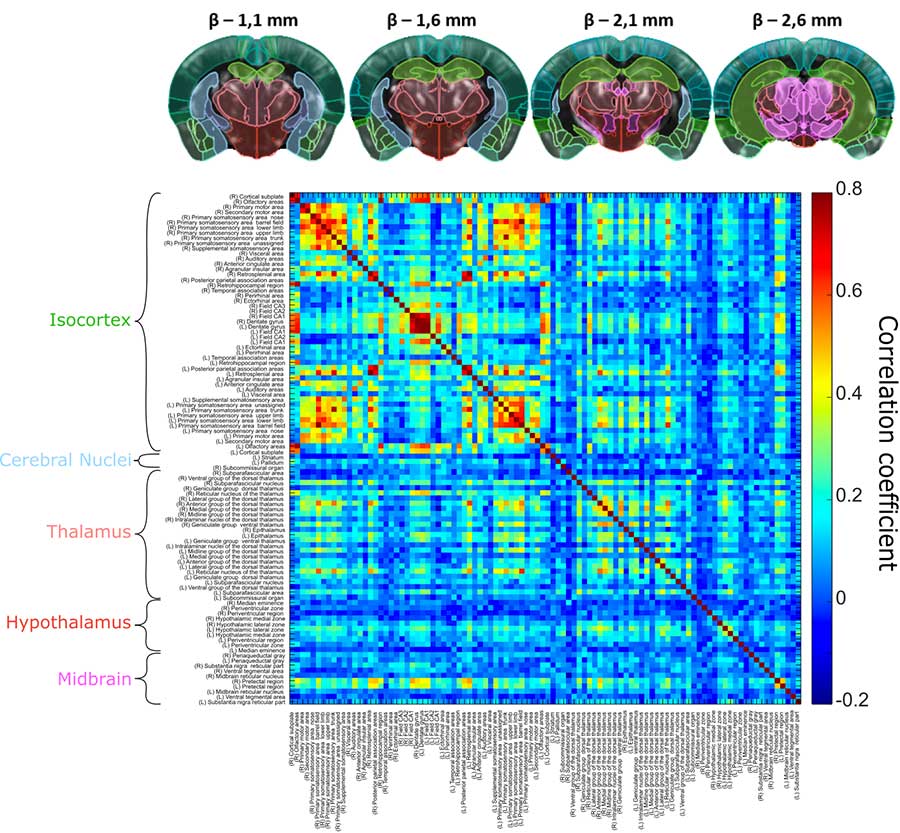
This 3D connectivity matrix for a mouse model was acquired non-invasively in 20 minutes, and shows strong interhemispheric connectivity patterns between four slices, with correlation coefficients up to 0.8. Reproduced from Bertolo et al., Journal of Visualized Experiments, 2021 (licensed under CC BY-NC-ND 3.0)
Another way of visualizing brain activity relationships is by correlating voxel activity across the whole brain with the activity of a small ‘seed’ region – known as seed-based (or ROI-based) functional connectivity.
This approach is not so dependent on the segmentation of the brain into functional regions, since you only need to define a single region.
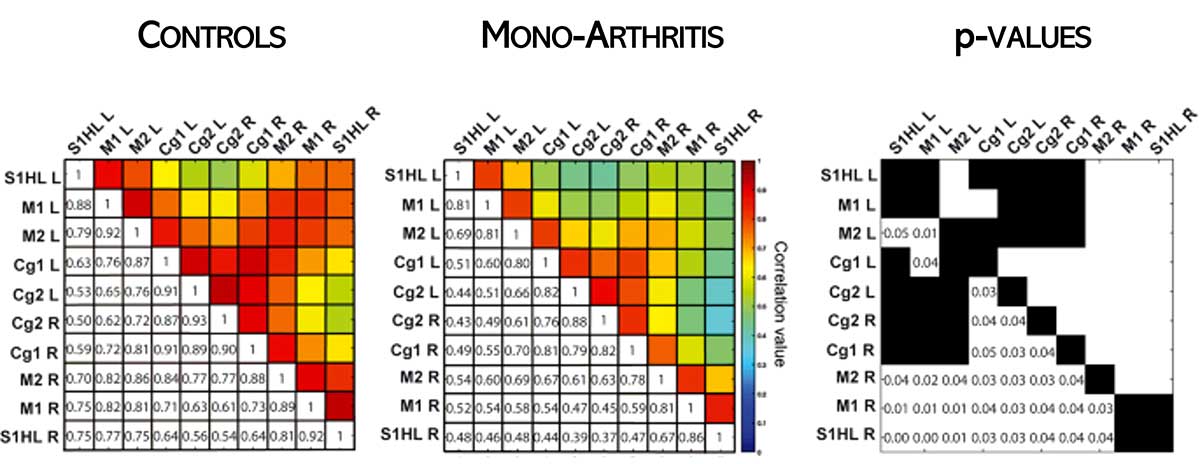
A different manifestation of functional connectivity is looking at how differences relevant to animal pathologies influence connectivity across the whole brain.
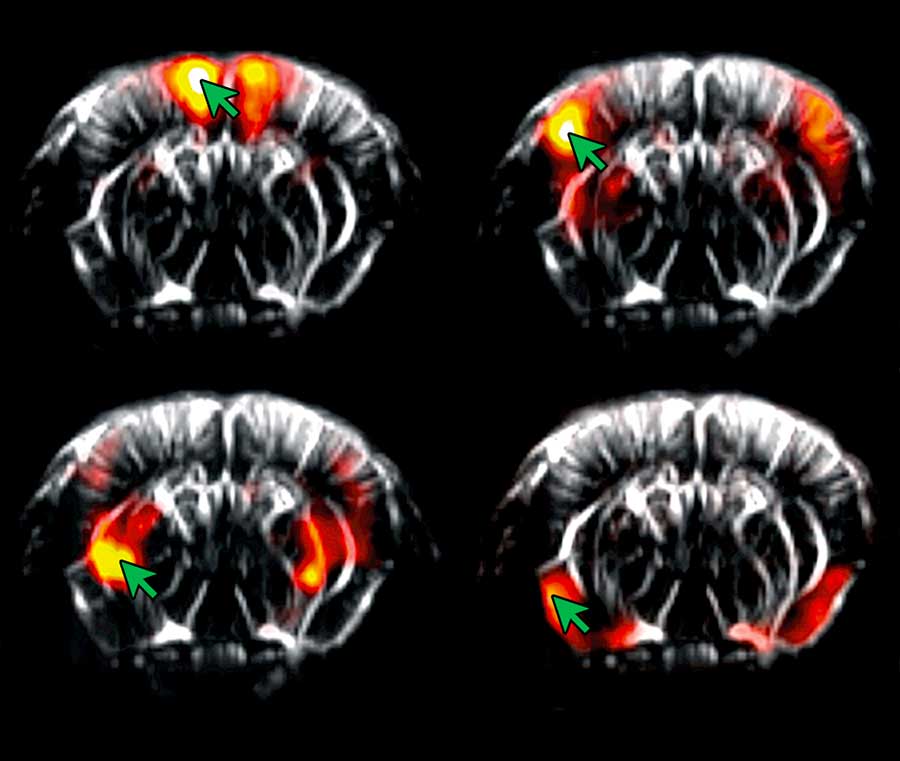
For example, functional ultrasound has been used to study the role of oxytocin in rat pups (Mairesse et al., Glia, 2019) and to investigate sensitivity to inflammatory pain in anesthetized rats, as shown here.
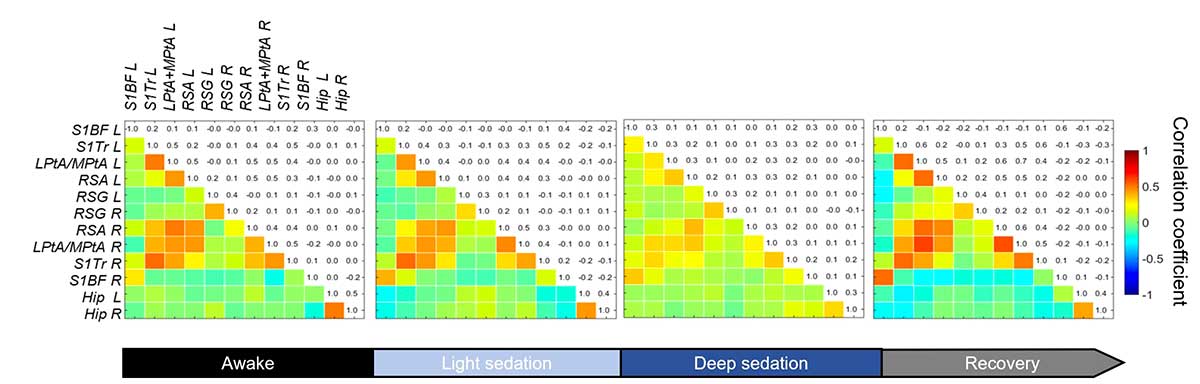
Connectivity matrices are normally developed for anesthetized animals, but an important development is using the light, robust Iconeus One probes to obtain results from awake mice (freely-moving or head-fixed), eliminating the bias of anesthetics.
As shown in the example below, this capability allows the effects on brain activity of anesthetics themselves to be studied, and it may also be relevant for analyzing genetically modified mice models.
| Cookie | Duration | Description |
|---|---|---|
| cookielawinfo-checkbox-advertisement | 1 year | Set by the GDPR Cookie Consent plugin, this cookie is used to record the user consent for the cookies in the "Advertisement" category . |
| cookielawinfo-checkbox-analytics | 11 months | This cookie is set by GDPR Cookie Consent plugin. The cookie is used to store the user consent for the cookies in the category "Analytics". |
| cookielawinfo-checkbox-functional | 11 months | The cookie is set by GDPR cookie consent to record the user consent for the cookies in the category "Functional". |
| cookielawinfo-checkbox-necessary | 11 months | This cookie is set by GDPR Cookie Consent plugin. The cookies is used to store the user consent for the cookies in the category "Necessary". |
| cookielawinfo-checkbox-others | 11 months | This cookie is set by GDPR Cookie Consent plugin. The cookie is used to store the user consent for the cookies in the category "Other. |
| cookielawinfo-checkbox-performance | 11 months | This cookie is set by GDPR Cookie Consent plugin. The cookie is used to store the user consent for the cookies in the category "Performance". |
| CookieLawInfoConsent | 1 year | Records the default button state of the corresponding category & the status of CCPA. It works only in coordination with the primary cookie. |
| elementor | never | This cookie is used by the website's WordPress theme. It allows the website owner to implement or change the website's content in real-time. |
| viewed_cookie_policy | 11 months | The cookie is set by the GDPR Cookie Consent plugin and is used to store whether or not user has consented to the use of cookies. It does not store any personal data. |
| Cookie | Duration | Description |
|---|---|---|
| _ga | 2 years | The _ga cookie, installed by Google Analytics, calculates visitor, session and campaign data and also keeps track of site usage for the site's analytics report. The cookie stores information anonymously and assigns a randomly generated number to recognize unique visitors. |
| _ga_CH52S2Y9PV | 2 years | This cookie is installed by Google Analytics. |
| _gat_gtag_UA_150322839_2 | 1 minute | Set by Google to distinguish users. |
| _gid | 1 day | Installed by Google Analytics, _gid cookie stores information on how visitors use a website, while also creating an analytics report of the website's performance. Some of the data that are collected include the number of visitors, their source, and the pages they visit anonymously. |
| _hjAbsoluteSessionInProgress | 30 minutes | Hotjar sets this cookie to detect the first pageview session of a user. This is a True/False flag set by the cookie. |
| _hjFirstSeen | 30 minutes | Hotjar sets this cookie to identify a new user’s first session. It stores a true/false value, indicating whether it was the first time Hotjar saw this user. |
| _hjIncludedInPageviewSample | 2 minutes | Hotjar sets this cookie to know whether a user is included in the data sampling defined by the site's pageview limit. |
| _hjIncludedInSessionSample | 2 minutes | Hotjar sets this cookie to know whether a user is included in the data sampling defined by the site's daily session limit. |
| CONSENT | 2 years | YouTube sets this cookie via embedded youtube-videos and registers anonymous statistical data. |
| Cookie | Duration | Description |
|---|---|---|
| VISITOR_INFO1_LIVE | 5 months 27 days | A cookie set by YouTube to measure bandwidth that determines whether the user gets the new or old player interface. |
| YSC | session | YSC cookie is set by Youtube and is used to track the views of embedded videos on Youtube pages. |
| Cookie | Duration | Description |
|---|---|---|
| _hjSession_2792005 | 30 minutes | No description |
| _hjSessionUser_2792005 | 1 year | No description |